Safe Games LA
Geospatial public-safety analytics and AI-assisted decision support for Los Angeles Olympic venues.
At a glance
LA28 venues covered by geospatial analytics
Crime, transit, weather, events, and emergency data
Gemini tool calling with deterministic Python calculations
See it in action
What needed solving?
Planning public safety for large events requires understanding historical incident patterns, transportation access, nearby emergency resources, and local conditions. This information is scattered across different datasets, making it difficult for planners to compare venues and identify potential coordination needs.
What I built
Developed a venue-focused analytics application integrating public-safety, transit, weather, event, and emergency-service datasets. Implemented geospatial analysis, interactive visualizations, venue comparisons, and a natural-language assistant that connects LLM-generated tool requests to deterministic Python calculations.
Overview
Safe Games LA is a geospatial analytics platform designed to support public-safety planning around Los Angeles 2028 Olympic venues. It combines historical crime records, transit infrastructure, emergency-service locations, event information, and weather data into interactive maps and venue-specific briefings. An AI assistant enables natural-language exploration of the underlying data.
System architecture
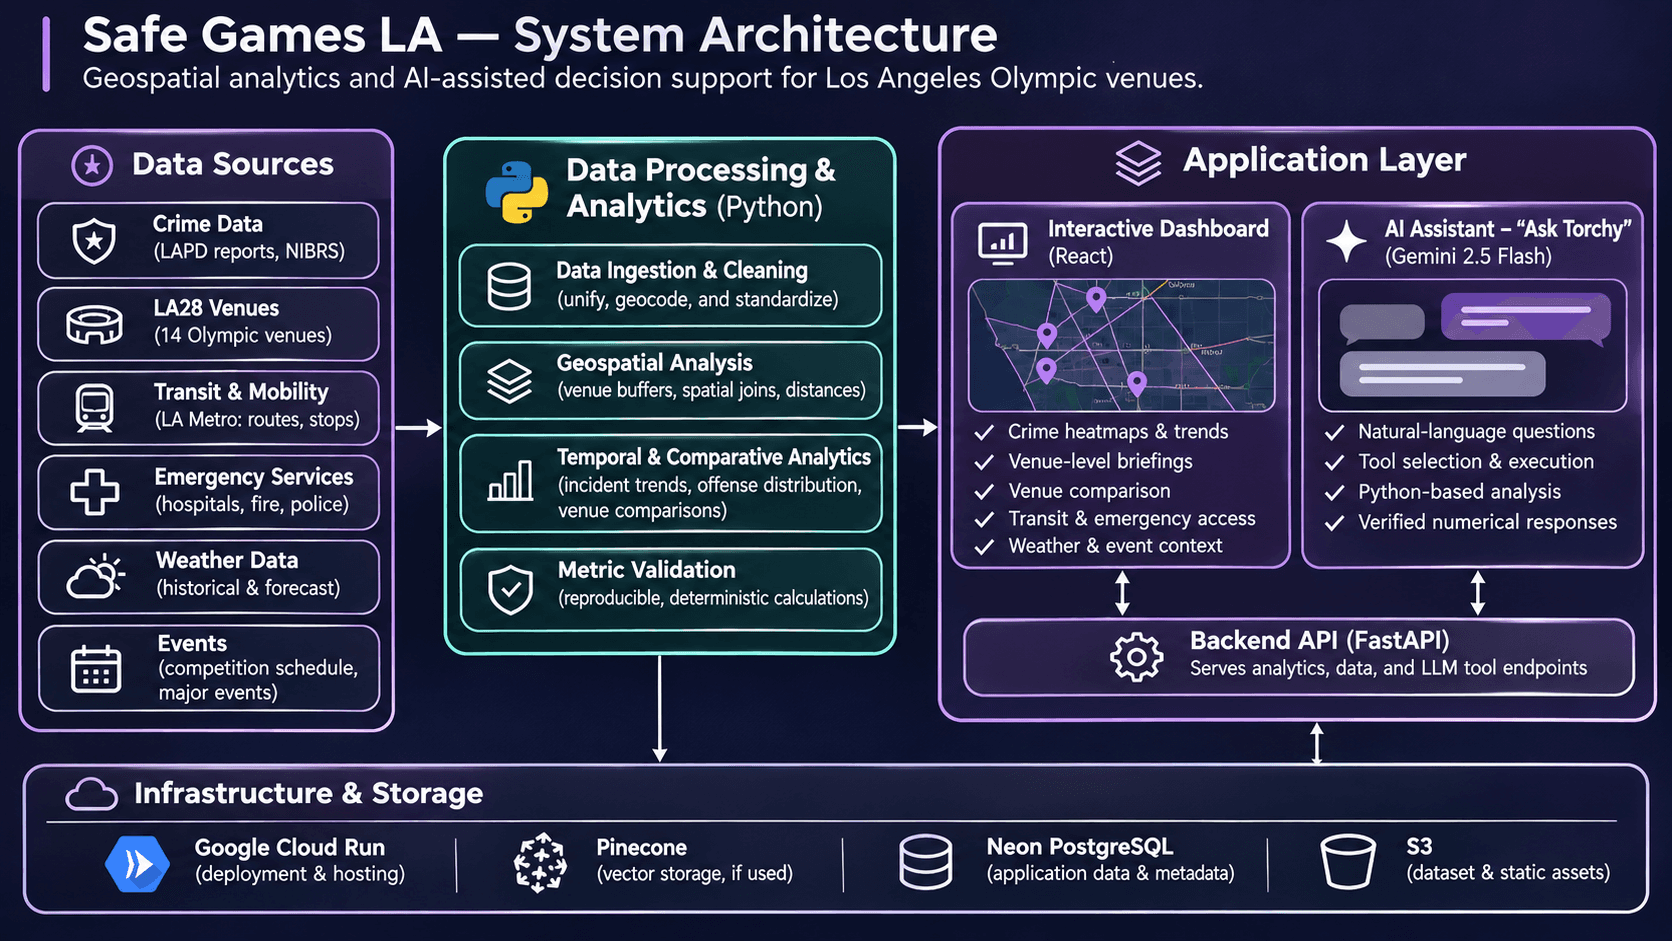
Explore the workflow
Process public datasets covering LAPD crime reports, NIBRS offenses, LA28 venues, Metro transit, emergency facilities, historical weather, and event information.
Decisions, validation & lessons
Engineering decisions & tradeoffs+
Venue-centered geospatial analysis
Organized the application around Olympic venues rather than presenting crime data as isolated citywide statistics. This allows planners to explore historical patterns alongside nearby transit and emergency resources.
Tradeoff: Fixed-radius geographic analysis can include overlapping venue areas and does not capture actual travel times, operational boundaries, or the causes of reported incidents.
Deterministic analytics with an LLM interface
Used Gemini to interpret questions and select analytical operations while keeping numerical calculations in Python. Generated responses are checked against the computed results.
Tradeoff: The assistant is limited by available analytical operations and dataset coverage. Numerical verification does not guarantee that every interpretation or explanation is correct.
Preserving dataset comparability
Kept LAPD police-report counts and NIBRS offense counts separate because the reporting systems measure different units. This avoids presenting changes in reporting methodology as changes in crime.
Tradeoff: Historical trends become more complex to visualize and explain, particularly around the March 2024 reporting transition.
Combining multiple planning signals
Integrated crime patterns, transit access, emergency facilities, weather, and event-day information to provide more useful venue-level context than a single-source dashboard.
Tradeoff: Different datasets have different geographic coverage, reporting periods, update schedules, and reliability constraints.
Validation & results+
The application includes Python unit tests and deterministic checks for analytical calculations. The AI assistant verifies generated numerical responses against the relevant venue, time period, and computed results. Historical comparisons account for changes in crime-reporting methodology. No independently validated prediction accuracy or operational public-safety impact is claimed.
Built an interactive briefing covering 14 LA28 venues, with crime heatmaps, venue-level analytics, comparative views, nearby emergency resources, and AI-assisted exploration.
Limitations & learnings+
Safe Games LA is a planning prototype, not a real-time crime prediction or emergency-response system. Historical incident concentrations do not establish future risk or causation. Geographic coverage and data completeness vary, reporting methodologies differ across periods, and the hosted application currently requires authorized access.
Explored geospatial data integration, historical trend analysis, interactive visualization, and tool-based LLM workflows. Focused on making numerical outputs reproducible, handling incompatible reporting systems, and communicating uncertainty in public-safety analytics.